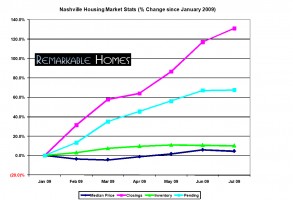
 The Middle Tennessee MLS (Realtracs) just released July 2009 stats. The following graph and analysis are based upon the residential single family homes and condos market. As you may recall in June, closings dramatically increased over May’s numbers. Did July continue to make an impression?
Total Inventory (Okay, Getting Better)
Inventory levels continued to slightly decrease in July, down 0.41 percent from June, but still up 10.19 percent since January. There were a total of 17,530 active homes and condos in Nashville last month, compared to July 2008 when there were 18,437 on the market, an encouraging year over year drop of 4.92 percent.
Pending Sales (Mixed, Improving)
Pending sales in Nashville are up rather significantly in 2009. Since January pending sales have soared 68 percent, but did not increase significantly since June. Compared to the same period in 2008, total pending sales are down 11.5 percent when 2,394 properties were pending. That may sound bad, but the gap between 2008 and 2009 pending sales has decreased a whopping 12.71 percent in the past 3 months alone.
Closed Sales (Good, Getting Better)
There is a very similar story to tell for Nashville’s closed sales as well. Since January closings have skyrocketed an astonishing 130.9 percent, a full 6.49 percent gain over June which was a 16.3 percent gain over May’s closings. Compared to the same period in 2008, year over year closings have only decreased 11.76 percent when 2,385 properties closed. In addition, we have narrowed the gap over 2008 by 14.1 percent during the past 3 months and that is better than 90 percent of all major US cities at the moment.
Median Prices (Better)
Median prices continue to remain extremely stable in the first 7 months of 2009, up 4.6 percent. Since June the median price eased slightly 1.24 percent to $172,628. Also, that median price is only down 3.84 percent since July 2008 when the median price was $177,665. The price gap has now narrowed by 6.06 percent in the last 60 days.
Months of Inventory (Better)
Based on July’s closed sales, it would take 8.21 months to clear it out our excess inventory. Based on pending sales (contracts accepted but not closed yet) it would take 8.16 months. Our absorption rate is significantly better over the past 2 months when we had 10.2 months of inventory based upon the same calculations – a 20% burn off decrease.
As I compare the year over year numbers in addition to looking at the past several months I am seeing an improving trend. If I was a day trader who traded on the trends, I would be very close to executing a trade. 3 of the 4 major indicators in the above analysis show a year over year narrowing trend while the fourth major indicator is running parallel. Taking seasonality into account, the 2009 numbers look as they should, but I am hesitant to allow for a full seasonal adjustment in this economy. I prefer to compare the current data to 2008 as the declining year model and make predictions based upon that assumption. If I also use 2006 as the increasing year model, I find that the trend analysis is more similar than dissimilar.
In other words, it may be time to definitively declare that the Nashville real estate market has bottomed out and is already rebounding. BUT, we might also be at a false bottom with another drop looming around the corner…only time and possibly Ben Bernanke can tell.
Reference the June 2009 analysis and the May 2009 analysis.


