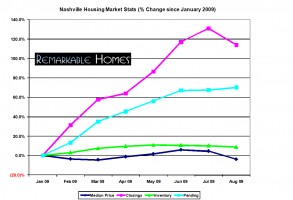
 The Middle Tennessee MLS (Realtracs) just released August 2009 stats. The following graph and analysis are based upon the residential single family homes and condos market only. As you may recall in July, closings and prices increased while total inventory was on the fall. Did August continue to buck the national trend or is it time for our typical seasonal fall?
Total Inventory (Okay, Getting Better)
Inventory levels continued to decrease in August, down 1.22 percent from July, but still up 8.86 percent since January. There were a total of 17,318 active homes and condos in Nashville last month, compared to August 2008 when there were 18,211 on the market, an encouraging year over year drop of 5.16 percent.
Pending Sales (Excellent, Improving)
Pending sales in Nashville are up rather significantly in 2009. Since January, pending sales have soared 70.12 percent higher. Also, for the first time this year, total pending sales are higher than their levels a year ago. August 2009 levels are 1.45 percent higher than August 2008 when 2,149 total properties were pending. This is very, very surprising news and represents a 12 percent month over month turnaround in addition to being a new 2009 benchmark high.
Closed Sales (Good, But Falling)
For the first time in 2009, total closings did not experience a month over month gain. Since January closings have risen 113.7 percent, but this number does represent a 13 drop from July. Compared to the same period in 2008, year over year closings have only decreased 9.97 percent when 2,172 properties closed. In addition, we have narrowed the gap over 2008 by another 2.1 percent during the past month. The fall in closings can be directly attributed to our natural seasonal drop, it is the 2.1 percent narrowing of the year over year gap that is encouraging.
Median Prices (Worse)
August saw the largest, and first since March, month over month price drop of 2009, dropping a full 8.25 percent to $158,376. Part of this drop can be directly attributed to first time home buyers and the other to the increasing numbers of short sales and foreclosures. The median price is down 9.75 percent compared August 2008 when the median price was $175,504.
Months of Inventory (Steady)
Based on Augusts’ closed sales, it would take 8.77 months to clear it out our excess inventory. Based on pending sales (contracts accepted but not closed yet) it would only take 7.946 months. Our absorption rate is significantly better over the past 3 months when we had 10.2 months of inventory based upon the same calculations – an 18% burn off decrease.
As I begin to take seasonality into account, I am seeing that the second half of 2009 is shaping up to be stronger than the second half of 2008. Yes total closings fell, yes the median price took at hit, but the graph clearly indicates that our overall market health is improving. We do expect the median price to continue to bottom feed for the remainder of the year as less million dollar properties are trading hands.
Prediction
Quite a few banks and lenders will be taking back properties this Fall. Look for median prices to decrease and closings/pending to increase, especially in the year over year analysis.


